Recently a neighbor in Berrien County (Frank Small) who has been interviewed by Support the Center, posted the picture chart shown just below.
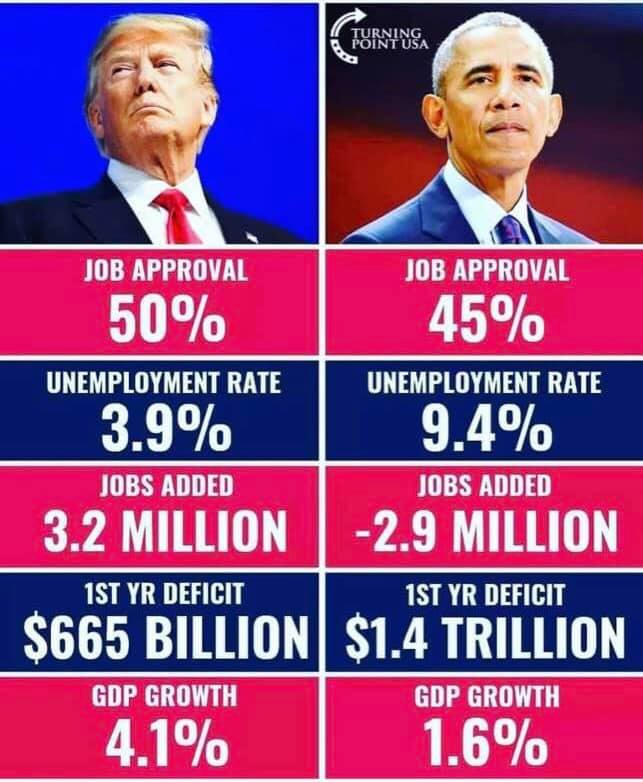
Frank was rewarded for his post with numerous positive comments. He claimed he had “proved” the obvious truth that Trump had created a great economy compared to the terrible economy he inherited from Obama.
I replied to his post by saying, “These ‘facts’ as a comparison of the economic track record of Obama versus Trump are so misleading as to not be truthful. If one has a concern for truth, then the entire record of Obama has to be posted.”
Frank countered my assertion by saying, “William Hurst sometimes it’s hard to see the forest except for trees”.
This blog is
- a refutation of the nature of Frank’s counter. Granted, Frank is a biased cheerleader, with advocacy as the goal,
- a critique of the exaggerations (not limited to Trump supporters) which riddle political Facebook posts, and finally,
- a reasoned examination and assessment of the Trump economy to date so we can assess where we stand, and think about future policy we want Trump and/or Congress to pursue.
I originally was going to reply to Frank within his post, on Facebook, but decided instead to put my reply on Support the Center, from which I will copy it to my Facebook page and then to Frank’s post, to get more exposure, and frankly, to maximize the value of this effort. I have noticed that folks who use Facebook as their main vehicle for political expression are often blessed by the ease with which misleading posts can be generated. Evidence is in short supply. I wish I could bring myself to reply with one misleading sentence!! In a country where group-think is so prevalent, having a conscience that requires more than a one sentence answer is, in one sense, a curse. But the extra effort below means this write-up must be utilized in multiple venues.
Taken On Their Own, Frank’s Comparative Facts Are Incomplete; We Need the Whole Picture
Frank’s assertion that “seeing the tree without the context of the forest” is false. A priori, regardless of circumstance, when doing economic analysis it is always better to know the full context within which specific data points fit. Trends are critical to seeing the whole picture. Exploring overall context is critical to assessing the economic performance of one President versus another.
Here is the broader context and the trends:
- From a low of 4.4% unemployment in May 2007, unemployment rose to 8.3% in January 2009 when Obama took office. This trend was severe and intractable while it lasted, as it was a result of a severe asset bubble in housing, the securities backing housing, and the Wall Street firms who took in these securities.
- Why did recovery take so long?
- Financial and asset bubble-caused recessions historically take the longest of all types of recessions for recovery. We can go through American economic history and this is the trend every time. We are not immune from history.
- We all know that many, many homeowners foreclosed on their houses, and that the majority of home sales during the Great Recession were short sales, depressing the housing market, and depressing consumption for many years as consumers recovered from poor balance sheets and rebuilt their wealth.
- The stock market took a nose dive during the Great Recession, losing almost 50% of its value by the time Obama took office, further reducing wealth of wealthier individuals who own stocks.
- The stock market reflected real conditions. Mortgage-backed securities, which were held by so many financial institutions, were opaque and impossible to value due to complex combinations of par and sub-par mortgages. Working hundreds of billions, even trillions of these securities, through the System ended up taking years, as it always does in crises of this sort.
- Businesses in turn were impacted by credit freezes as banks could not loan, consumers could not refinance, consumers lost wealth as their houses lost value, home owners went into foreclosure, and confidence shrank.
- International trade was depressed. The Great Recession was exported by the US, impacting the entire Western world and banking system.
- Under Obama, the economy reversed these negative trends after 9 months, in many cases exceeding the best of Trump’s economy so far. Here are some examples:
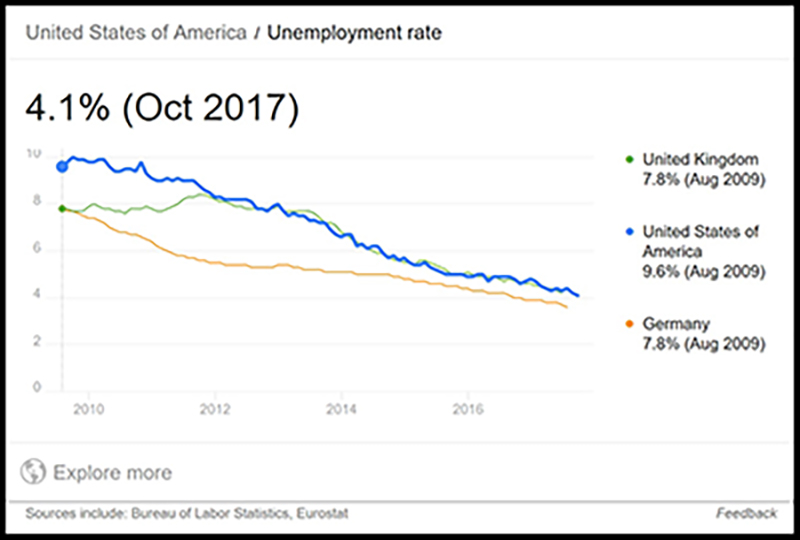
- Unemployment steadily went down from a 10% peak in Oct 2009 to 4.7% when Obama left office.
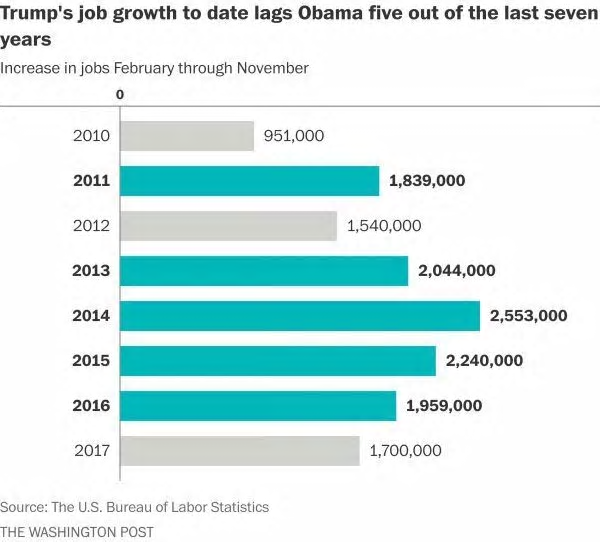
- Trump’s first year (2017) job growth trailed Obama’s in 5 of Obama’s 7 years:

- Obama’s quarterly GDP growth exceeded Trump’s Q2 2018 4.2% GDP growth three different times:
- 5.1% in Q2 2014
- 4.9% in Q3 2014
- 4.7% in Q1 2011
- Frank might argue that these high quarterly growth rates during Obama’s years were not sustained as annual rates. Exactly – THAT IS THE POINT OF THIS BLOG.
- Obama produced a steady downward trend in unemployment from 2009 on:
- Bottom Line: Has Trump produced higher sustainable annual productivity and growth rates? The evidence is not in yet. What is clear is that Trump benefited from a solid trend of growth Obama handed to him, with some higher than trend growth recently that may or may not be sustainable. Unfortunately, the evidence below does not point to sustainability of this growth. Poor policy choices Trump has made may create headwinds for the economy in 2019.
The 2018 Tax Cut – A Trump “Sugar High” leading to 2018 Growth, But A Negative for Future Growth, As It Spawns Record Deficits During Full Employment
- The 2018 Tax Cut is covered by Support the Center, and it is a negative for average Americans and for future economic growth. See that post.
- 42% of its benefits on the personal side go directly to the very rich – the 1% earning $400,000 or more a year. Middle class taxpayers will get just a little bit, but as the economy is squeezed by increasing deficits, 1.5 trillion or more to be caused by this tax bill (depending on growth rates), more than outweigh the middle class benefits as reductions in their benefits by Republicans, to pay for this tax cut, will be required.
- Trump deficits are shooting up – a deficit of $779 billion is projected for 2018 and $1 trillion and more is projected for 2019 on, representing 4% of GDP on 2018 and more in later years. This is alarming given that we are at full employment. It is unsustainable, and portends hard choices in future years that make clear extraordinary mismanagement by Trump’s and the Republican Congress of the budget.
- Businesses paid $79 billion less in taxes in 2018 due to the tax bill, but there is little evidence that much of this went to new investment that would not have occurred otherwise in a strong economy, or has caused sustained increases in investment. Most of it went to stock buybacks which were at record levels in 2018.
- Yes, there was a temporary increase in business investment in Q1 and Q2 of 2018. Non residential business fixed investment increased by 11.5% annual rate in Q1 and 8.5% in Q2. But since then, business investment has slowed to less than Obama levels. Overall, itwas .8% in Q3. Investments in mines, factories and other structures fell by 7.9%. Investments in capital equipment growth slowed to a .4% annual rate., the slowest growth since 2016. It is clear the growth induced by the tax cuts in early 2018 has now worn off.
The Trade Wars and Other 2019 Headwinds
The trade wars are disrupting supply chains in ways that will have unpredictable impacts on growth.
- Increased tariffs are taxes on consumers and burdens to businesses with international supply chains. They add another risk to the economy in 2019.
- The recently re-negotiated NAFTA agreement mainly increased domestic content on North American produced cars. It is a step back from free-trade, and as such will increase the price of cars (a hidden burden on consumers) in the long run. (Many of the provisions of the new NAFTA were taken from the TPP agreement Trump rejected and would have been part of it.)
- Business investment is based on growth prospects for the economy, now facing headwinds from a poor worldwide outlook for growth, a terrible stock market, and reductions in housing and auto demand. Not a good recipe for growth.
The stock market is in turmoil right now. Those of us who depend on it for our nest egg are right to be alarmed at the unpredictability Trump has interjected in our economy.
Conclusion
Those of us who have retirement savings in the market who are dependent on good economic stewardship by Trump and Congress, know that one 4.2% growth number does not assure higher future growth. Trump inherited positive trends from Obama, and the jury is out on whether he will be a better or worse steward of the economy than Obama. Already, Trump, with Republicans in Congress, has made a large policy mistake in passing a tax bill that will only benefit the rich and which increases the deficit in a full-employment economy. And Trump has sown uncertainty in the economy far beyond the over-regulatory instincts of the Obama administration. So far Trump is an erratic performer.
No one can claim based on current facts that Trump’s economic management has produced a better result than in the past. We need many more quarters to evaluate Trump’s economic stewardship. We do know for sure that the US fiscal position has not been improved by the 2017 Tax cut.